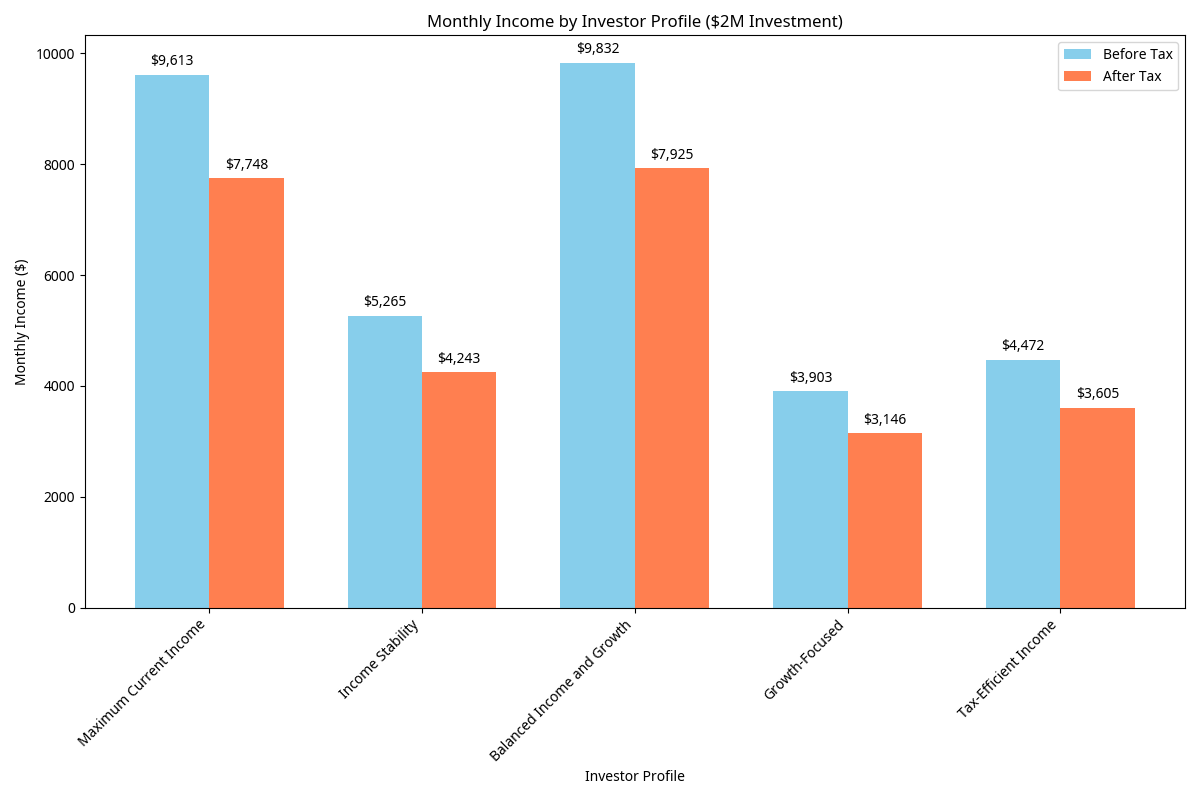
Monthly Income Potential
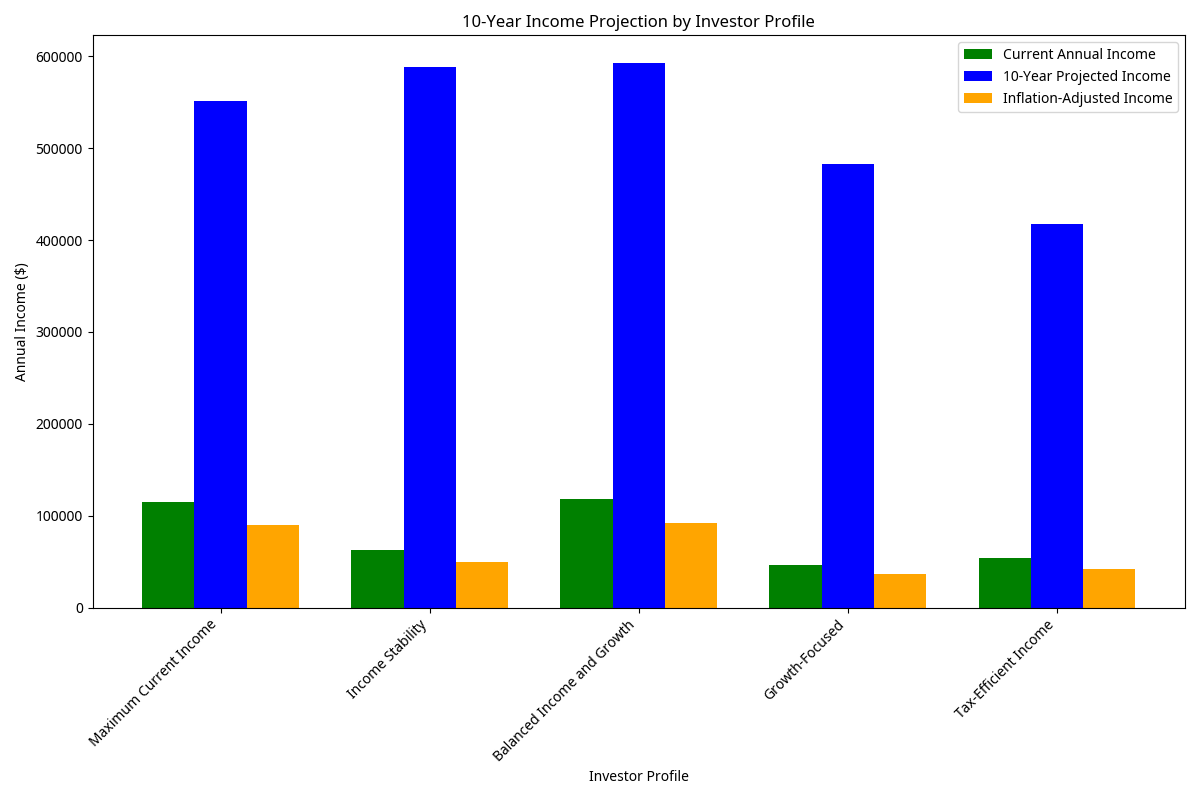
Our research identified five optimal portfolio strategies, each designed for different investor priorities. The chart shows monthly income potential (before and after tax) for each strategy based on a $2 million investment.
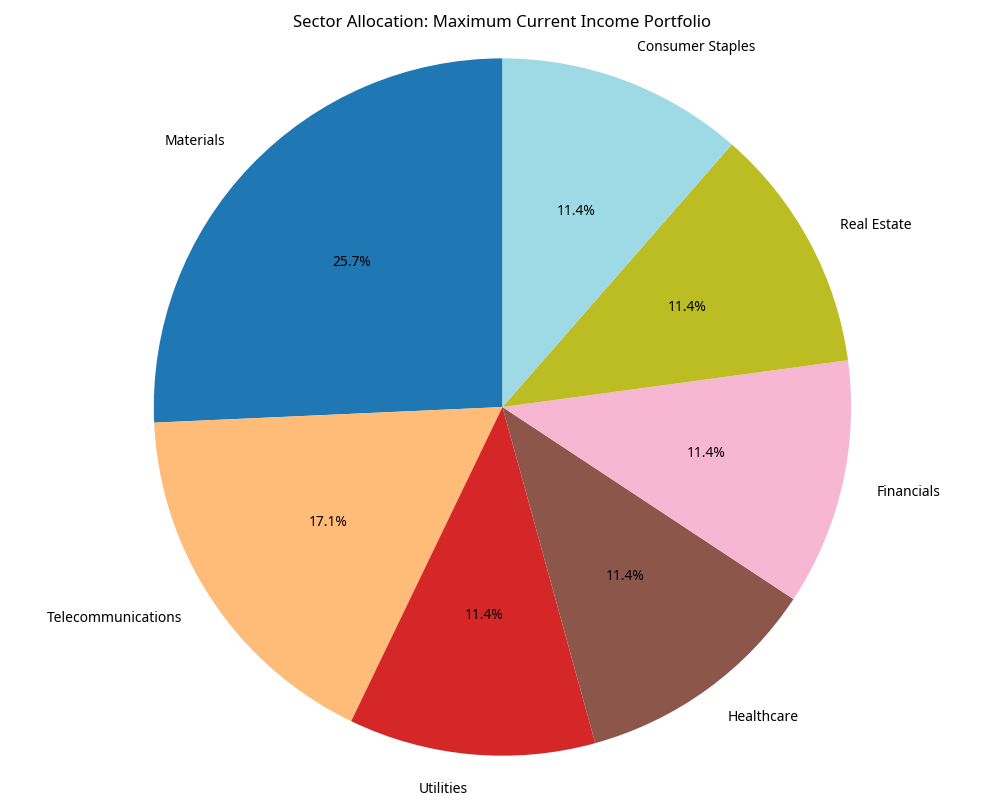
- Maximum Current Income: Highest immediate yield (5.93%) with monthly income of ~$8,200 after tax
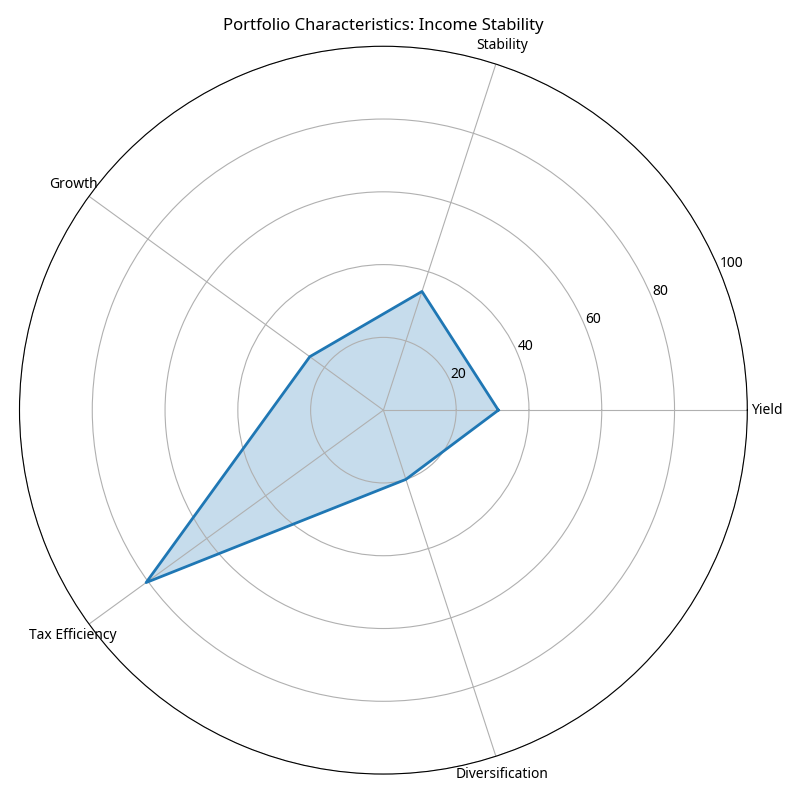
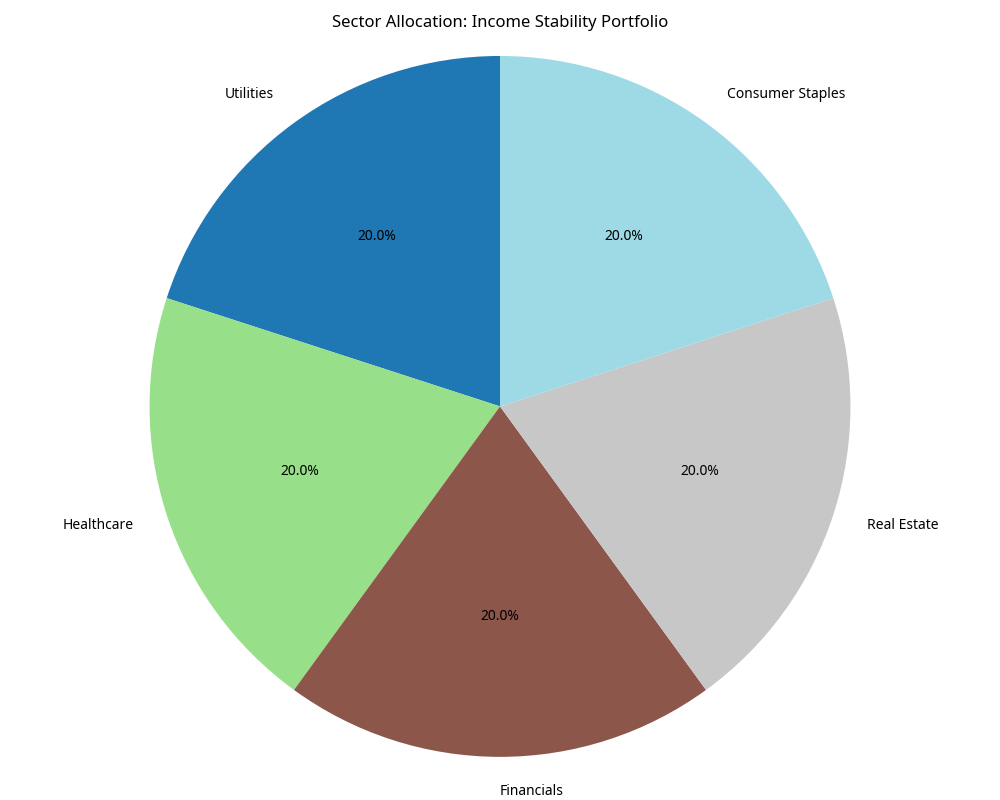
- Income Stability: Most reliable income stream with lower volatility (5.21% yield)
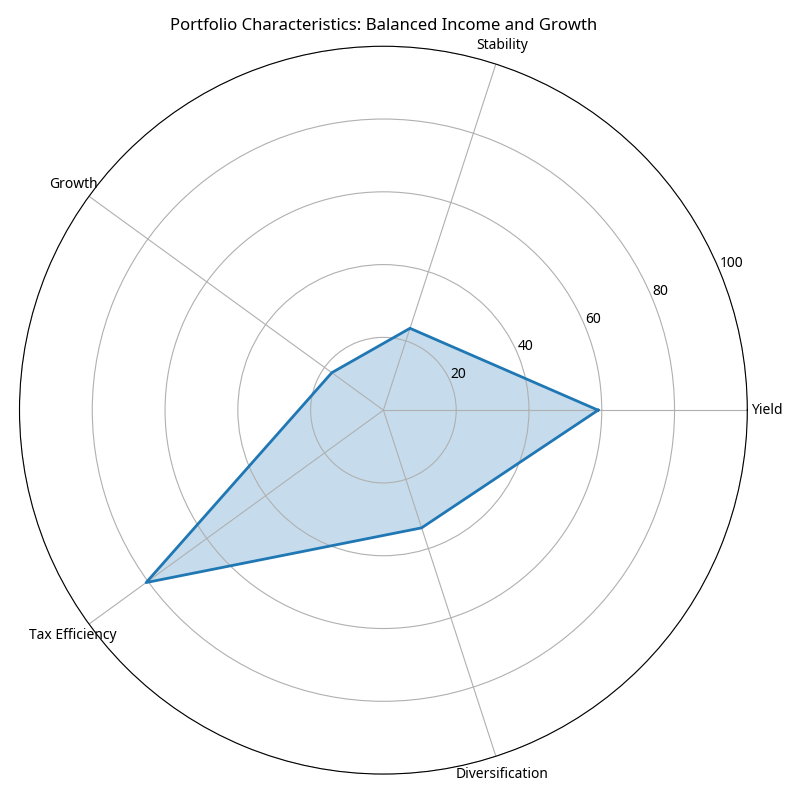
- Balanced Income and Growth: Best inflation protection over time
- Growth-Focused: Lower initial income but highest 10-year projections
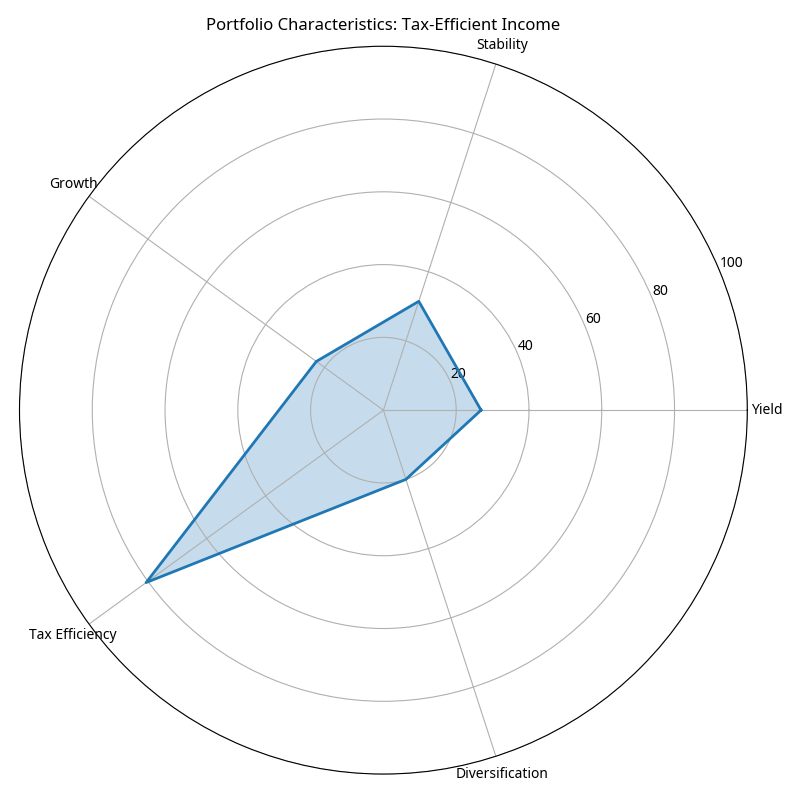
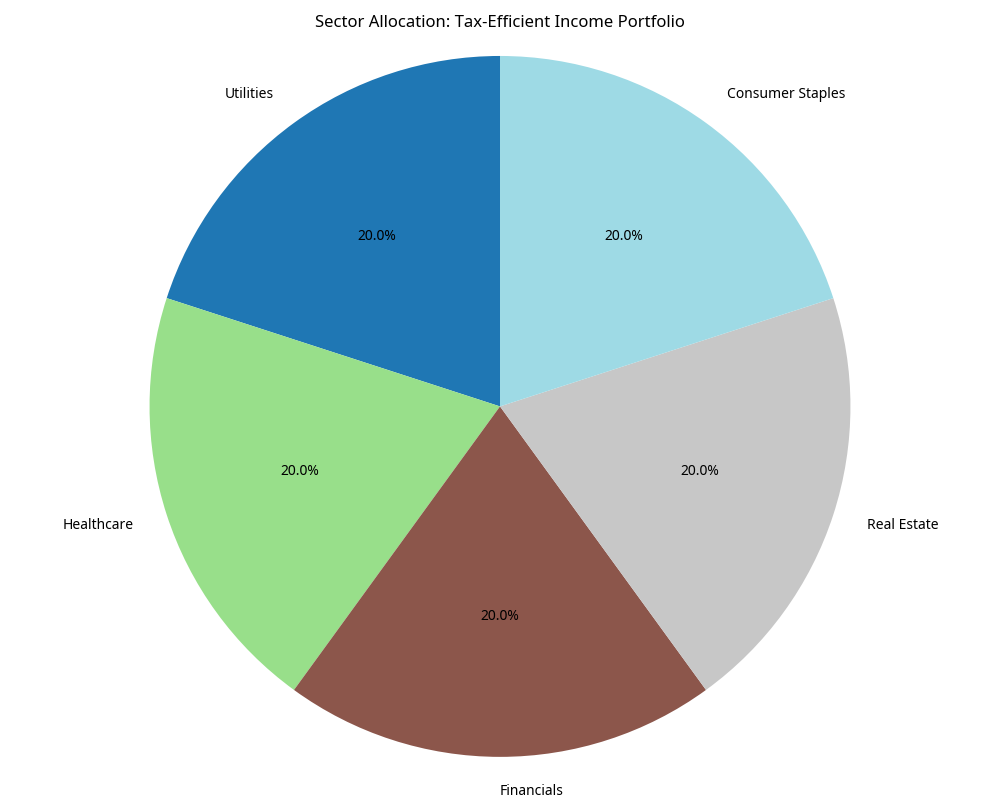
- Tax-Efficient Income: Maximizes after-tax returns through qualified dividends